Plot density of variable values with per-group overlays
Source:R/plot_cluster_density.R
plot_group_density.RdFor each variable, plots kernel density estimates with per-group overlays (density curves and/or median lines). Returns a named list of ggplot2 objects or a single faceted plot.
Usage
plot_group_density(
  .data,
  group,
  vars = NULL,
  col_clusters = NULL,
  palette_group = "auto",
  n_col = NULL,
  n_row = NULL,
  density = "both",
  scale = "max_overall",
  scales = "free_y",
  expand_coord = NULL,
  exclude_min = "no",
  rug = NULL,
  density_overall_weight = NULL,
  bandwidth = "hpi_1",
  max_n = NULL,
  na_rm = TRUE,
  alpha = 0.75,
  label = FALSE,
  legend = NULL,
  font_size = 14,
  thm = cowplot::theme_cowplot(font_size = font_size) + ggplot2::theme(plot.background =
    ggplot2::element_rect(fill = "white", colour = NA), panel.background =
    ggplot2::element_rect(fill = "white", colour = NA)),
  grid = cowplot::background_grid(major = "xy")
)

plot_cluster_density(.data, cluster, palette_cluster = "auto", ...)
Arguments
- .data
data.frame. Rows are observations. Must contain a column identifying group membership and columns for variable values.
- group
character. Name of the column in
.datathat identifies group membership.- vars
character vector or
NULL. Names of columns in.datato use as variables. IfNULL, all columns exceptgroupare used. Default isNULL.- col_clusters
named character vector or
NULL. Per-group colours. Names should match group labels. WhenNULL(default), colours are chosen automatically bypalette_group.- palette_group
character. Palette used for automatic colour assignment when
col_clustersisNULL. One of"auto"(default),"okabe_ito","paired","kelly","glasbey", or"hue_pal". See the Colour palette section of Details.- n_col
integer or
NULL. Number of columns passed toggplot2::facet_wrap. If supplied (or ifn_rowis supplied) a single faceted plot is returned instead of a list. Default isNULL.- n_row
integer or
NULL. Number of rows passed toggplot2::facet_wrap. If supplied (or ifn_colis supplied) a single faceted plot is returned instead of a list. Default isNULL.- density
character. What density to display. One of
"both"(default: overall density curve plus per-cluster density curves),"overall"(overall density curve plus cluster median lines), or"cluster"(one density curve per cluster, coloured by cluster). See Details.- scale
character. How to scale per-cluster density curves. Only relevant when
densityis"cluster"or"both". One of"max_overall"(default: each cluster density is rescaled so that its maximum equals the maximum of the overall density, keeping y-axis values comparable to the overall density),"max_cluster"(no rescaling; y-axis is determined by the tallest curve), or"free"(no rescaling; equivalent to"max_cluster").- scales
character. The
scalesargument passed toggplot2::facet_wrapwhen a faceted plot is requested. Default is"free_y"so that the x-axis is shared across panels.- expand_coord
numeric vector or named list or
NULL. Expands the x-axis limits to include the given values. A plain numeric vector is applied to every variable. A named list (names = variable names, values = numeric vectors) applies expansion per variable. When a faceted plot is requested vian_col/n_rowand a named list is provided, a warning is issued andexpand_coordis ignored (incompatible with faceting). Default isNULL.- exclude_min
character. Whether to exclude observations whose value equals the minimum from the density and median calculations. Options are:
"no"(default, no exclusion),"overall"(exclude observations whose value equals the global minimum across all variables), or"variable"(for each variable, exclude observations whose value equals that variable's minimum).- rug
character or
NULL. Controls the rug added below the density.NULL(default): per-cluster rug whendensityis"cluster"or"both", overall rug whendensityis"overall"."cluster": per-cluster rug, coloured by cluster."overall": overall rug with no cluster colouring. See Details.- density_overall_weight
character or
NULL. Controls weighting of the overall density whendensityis"overall"or"both".NULL(default): the overall density is estimated from all observations pooled together."even": the overall density is computed as an equal-weight average of per-cluster kernel densities, preventing larger clusters from dominating the density estimate. Ignored whendensityis"cluster".- bandwidth
character or positive numeric. Bandwidth used for per-cluster kernel density estimation. One of
"hpi_1"(default),"hpi_0","SJ", or a positive number. See Details.- max_n
numeric or
NULL. Optional per-group cap for observations used to estimate densities. DefaultNULLuses all available observations. When numeric, groups with more thanmax_nobservations are randomly sampled down tomax_nfor density calculations.- na_rm
logical. Whether to remove
NAvalues from each variable before computing densities and medians. WhenTRUE(default),NAvalues are removed and a message is issued showing how many were removed per variable. WhenFALSE,NAvalues are passed directly tostats::density(), which will strip them with its own warning.- alpha
numeric. Transparency applied to density curves (both overall and per-group lines). Must be between 0 (fully transparent) and 1 (fully opaque). Default is
0.75.- label
logical. Whether to add on-plot labels at the highest-density peak of each group using
ggrepel::geom_text_repel. Whendensityis"overall", labels are placed at the overall-density value at each group's median. Default isFALSE.- legend
logical or
NULL. Whether to display the legend.NULL(default): the legend is shown when the number of groups is 15 or fewer and hidden otherwise.TRUE/FALSE: always show/hide the legend, overriding the default behaviour.- font_size
numeric. Font size passed to
cowplot::theme_cowplot. Default is14.- thm
ggplot2 theme object or
NULL. Default iscowplot::theme_cowplot(font_size = font_size)with a white plot background. Set toNULLto apply no theme adjustment.- grid
ggplot2 panel grid or
NULL. Default iscowplot::background_grid(major = "xy"). Set toNULLfor no grid.- cluster
character. Name of the column in
.datathat identifies group membership. Alias for thegroupparameter.- palette_cluster
character. Alias for
palette_groupinplot_group_density(). See the Colour palette section of Details.- ...
Additional arguments passed to
plot_group_density().
Value
A named list of ggplot2 objects (one per variable) when neither
n_col nor n_row is specified. A single ggplot2 object with
facet_wrap panels when n_col or n_row is specified.
Details
Density modes
The density argument controls what is shown:
"both"(default): the overall density curve plus one density curve per group, coloured by group. Group curves are scaled according to thescaleargument."overall": the overall density of all observations with a vertical line per group at that group's median value."cluster": one density curve per group, coloured by group.
Rug
A rug is added by default. The rug argument controls which data it shows:
NULL(default): per-group rug whendensityis"cluster"or"both", overall rug whendensityis"overall"."cluster": per-group rug, coloured by group."overall": overall rug (no group colouring).
Bandwidth
The bandwidth argument controls per-group bandwidth selection (used for
per-group density curves and for the even-weighted overall density):
"hpi_1"(default):ks::hpi(x, deriv.order = 1)— plug-in bandwidth based on the first derivative, less sensitive to group size than SJ."hpi_0":ks::hpi(x, deriv.order = 0)— plug-in bandwidth based on the density itself."SJ": Sheather-Jones bandwidth viastats::bw.SJ().A positive numeric value: use that value as the bandwidth directly.
If bandwidth estimation fails, a warning is issued and the default
(stats::bw.nrd0) bandwidth is used as a fallback.
Layout
By default the function returns a named list of ggplot2 objects, one per
variable. If n_col or n_row is supplied the plots are instead combined
into a single faceted ggplot2 object via facet_wrap.
Colour palette
When col_clusters is NULL, group colours are assigned automatically
based on palette_group. The "auto" strategy selects a palette by the
number of groups:
1–8 groups: Okabe-Ito — colorblind-safe 8-colour palette.
9–12 groups: ColorBrewer Paired — 12 colours pairing light and dark versions of 6 hues.
13–21 groups: Kelly's palette (optional
Polychromepackage) — 21 colours of maximum perceptual contrast (white excluded). Falls back tohue_pal()with a warning ifPolychromeis not installed.22–31 groups: Glasbey's palette (optional
Polychromepackage) — 31 algorithmically spaced colours (white excluded). Falls back tohue_pal()with a warning ifPolychromeis not installed.> 31 groups:
hue_pal()— evenly spaced hues (a warning is issued).
Set palette_group explicitly to override the automatic selection (provided
the chosen palette supports at least as many colours as there are groups).
Examples
set.seed(1)
.data <- data.frame(
group = rep(paste0("C", 1:3), each = 20),
var1 = c(rnorm(20, 2), rnorm(20, 0), rnorm(20, -2)),
var2 = c(rnorm(20, -1), rnorm(20, 1), rnorm(20, 0))
)
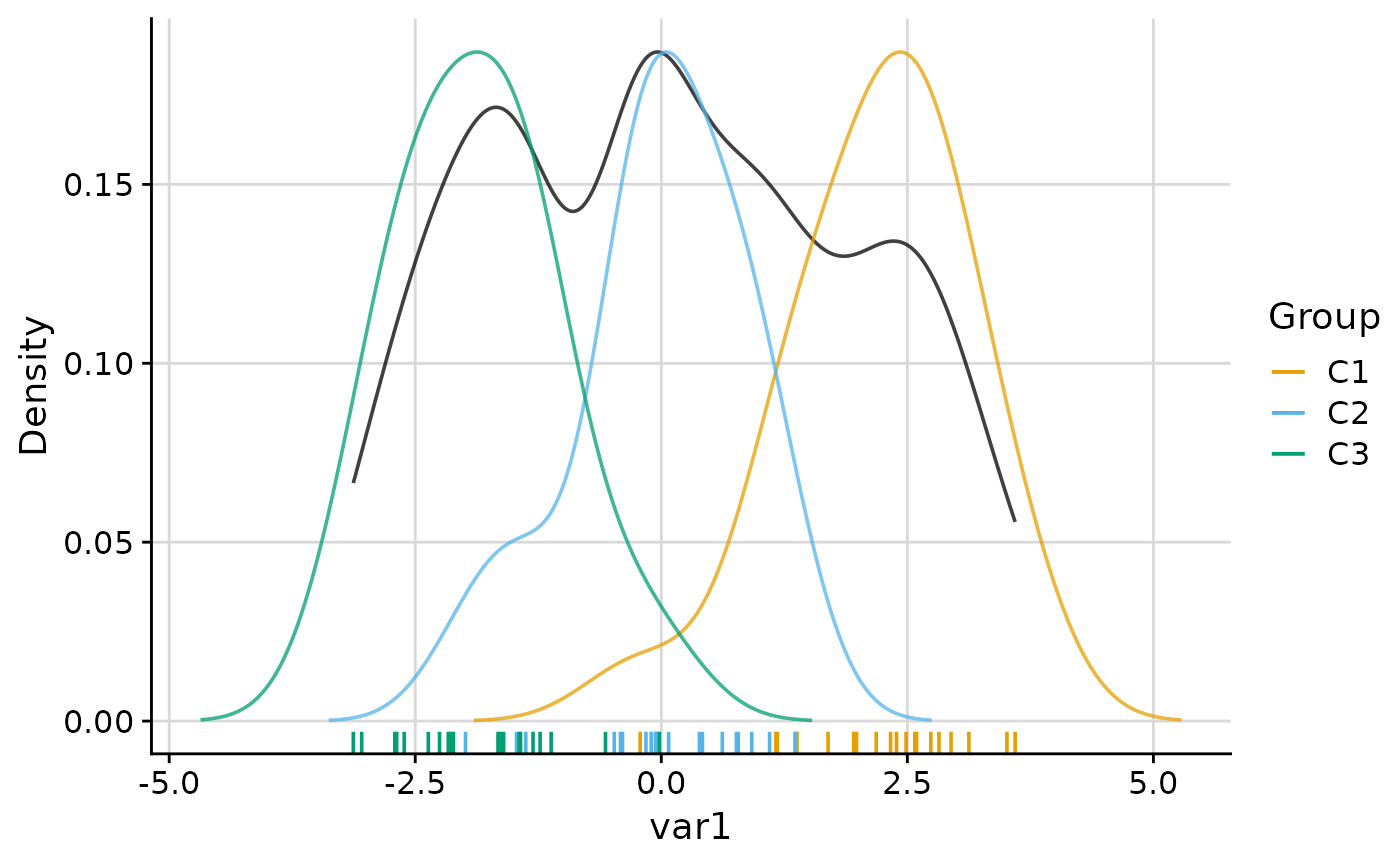
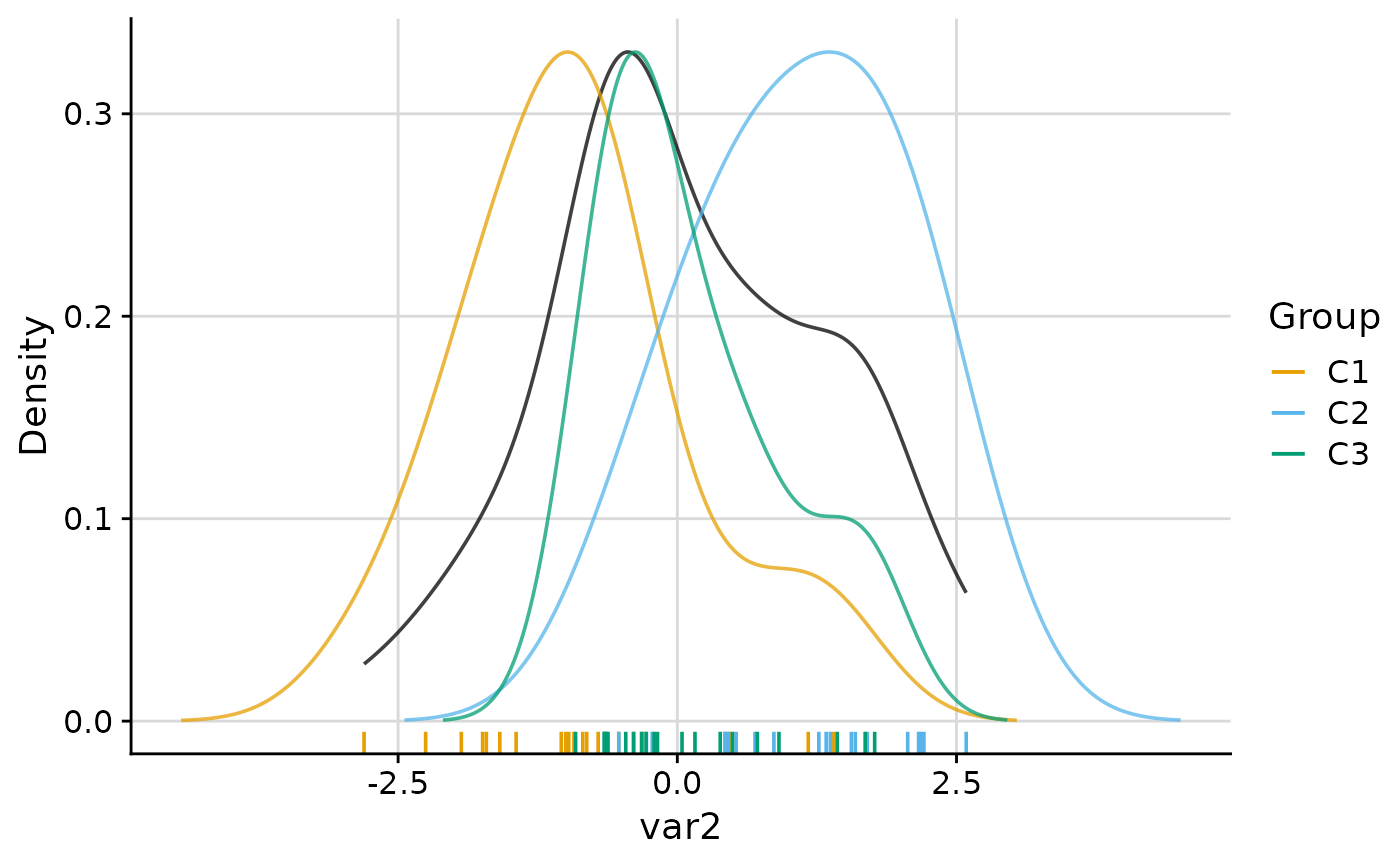
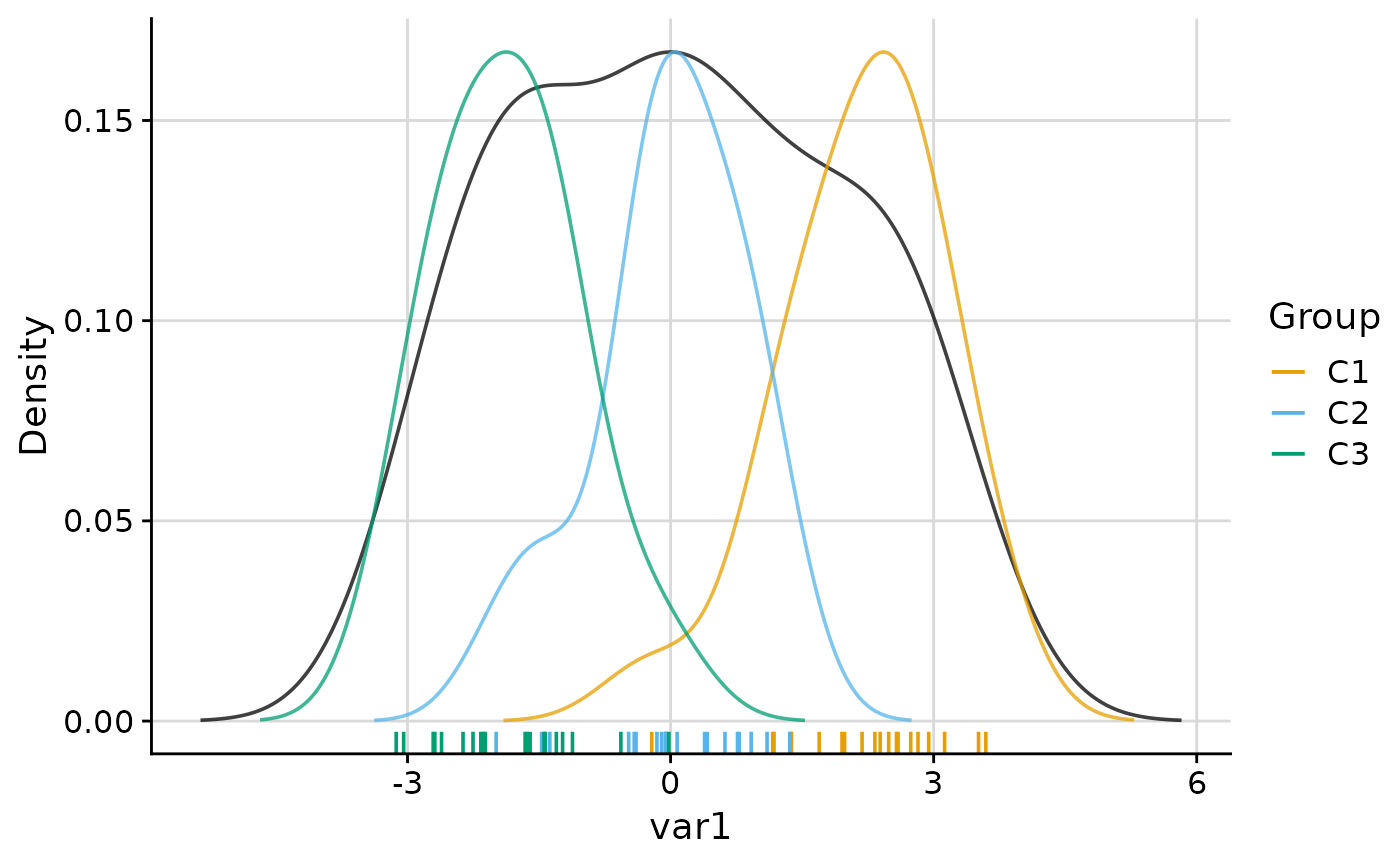
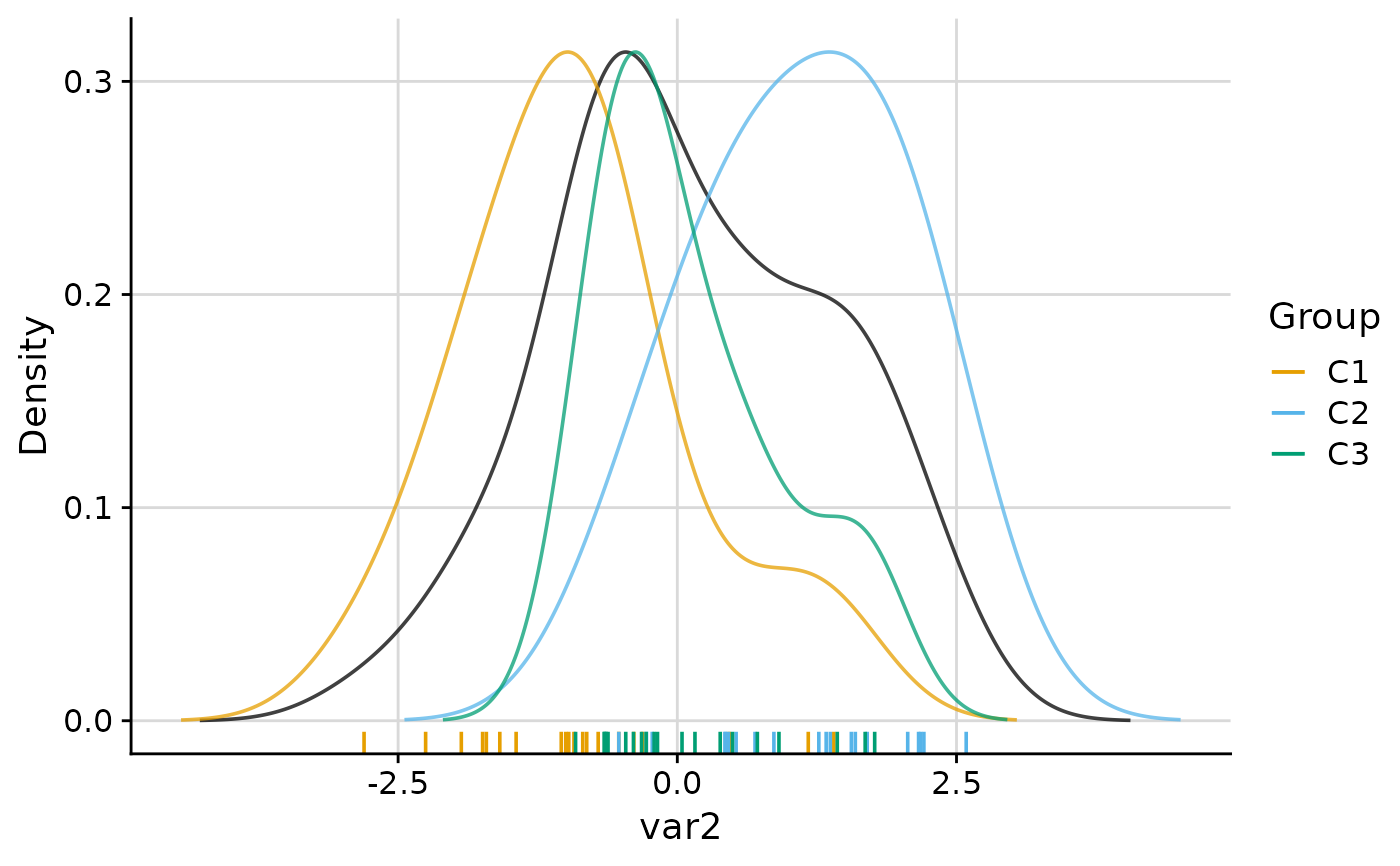
# Default: overall + per-group density curves
plot_list <- plot_group_density(.data, group = "group")
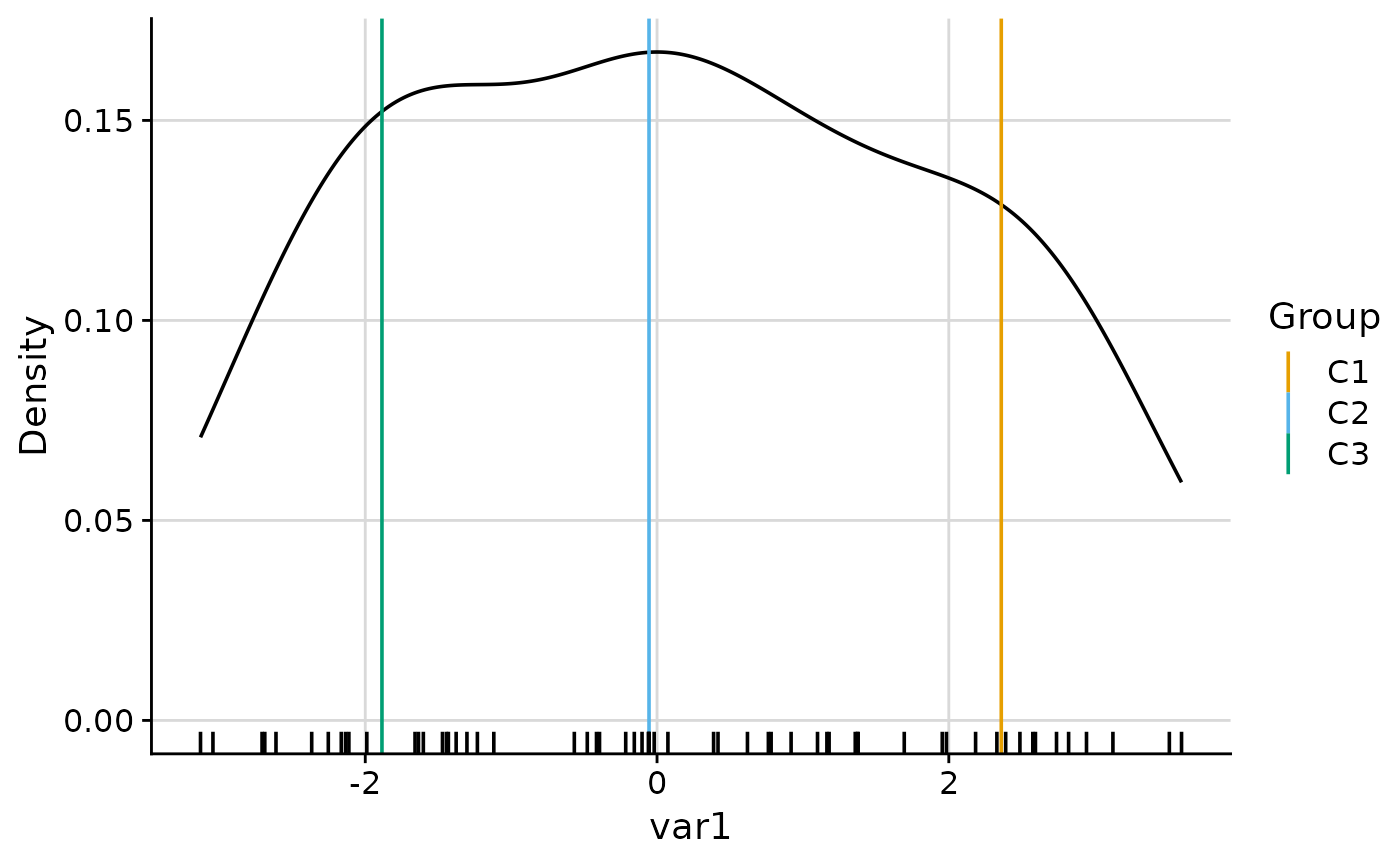
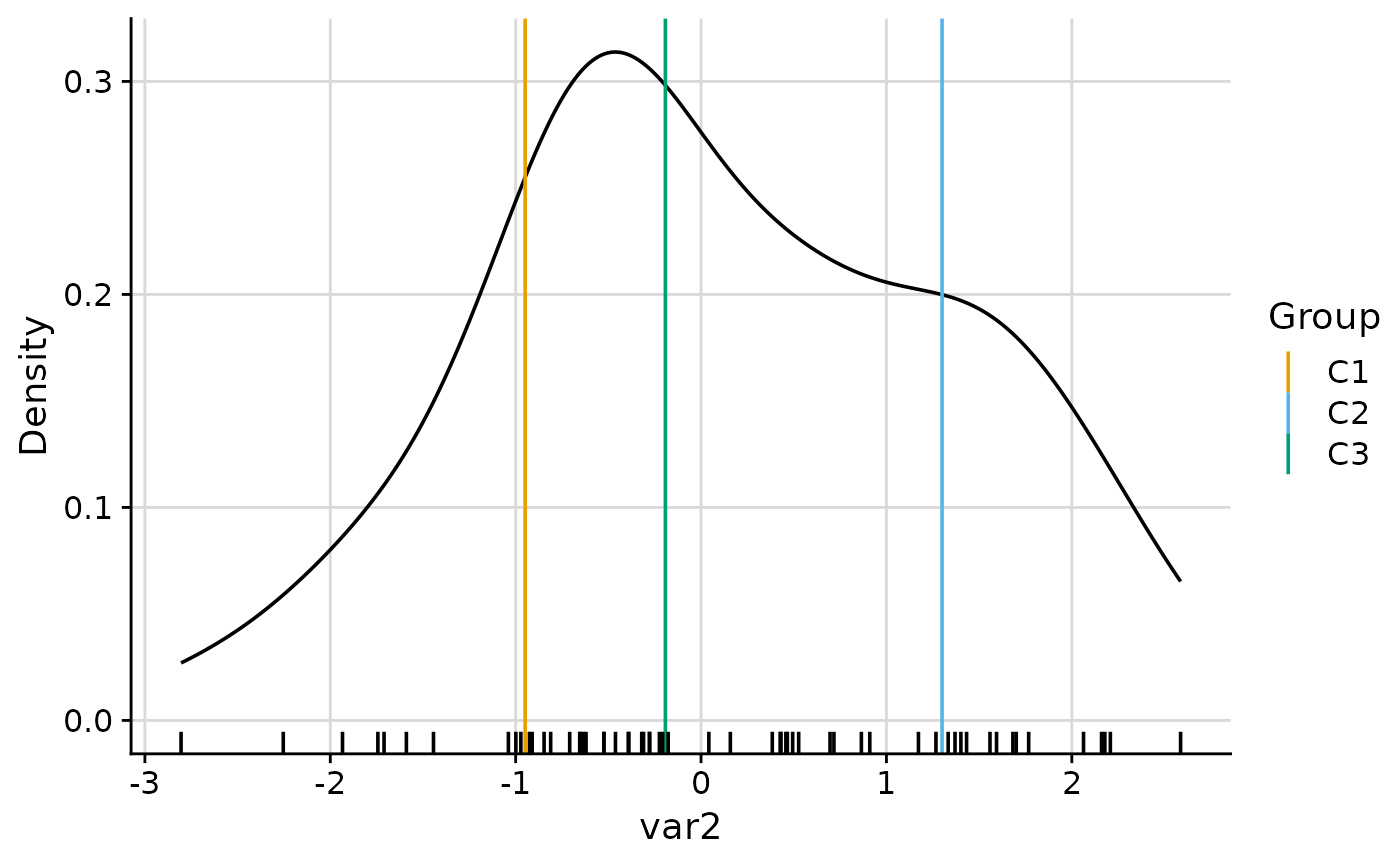
# Overall density with group median lines only
plot_group_density(.data, group = "group", density = "overall")
#> $var1
 #>
#> $var2
#>
#> $var2
 #>
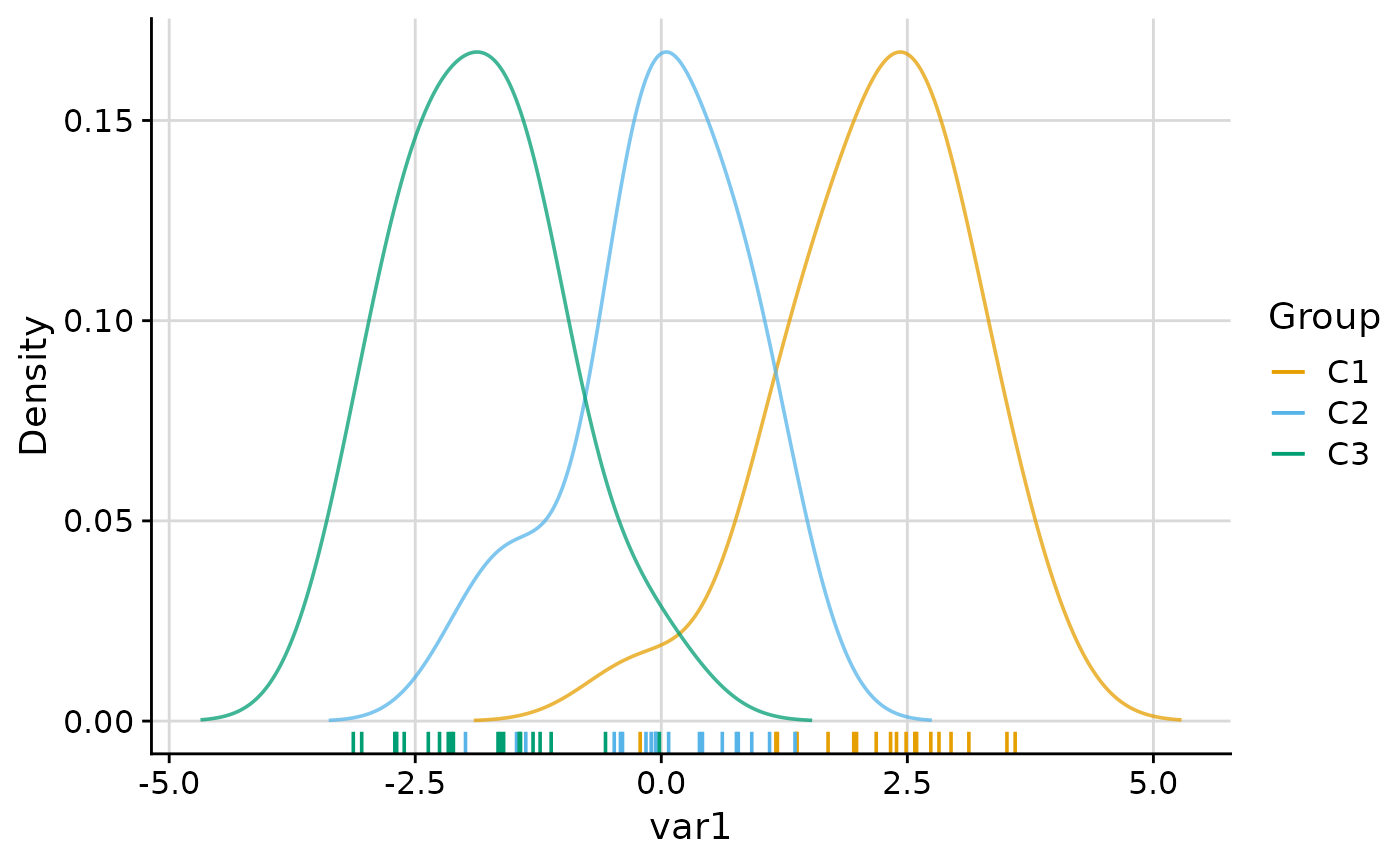
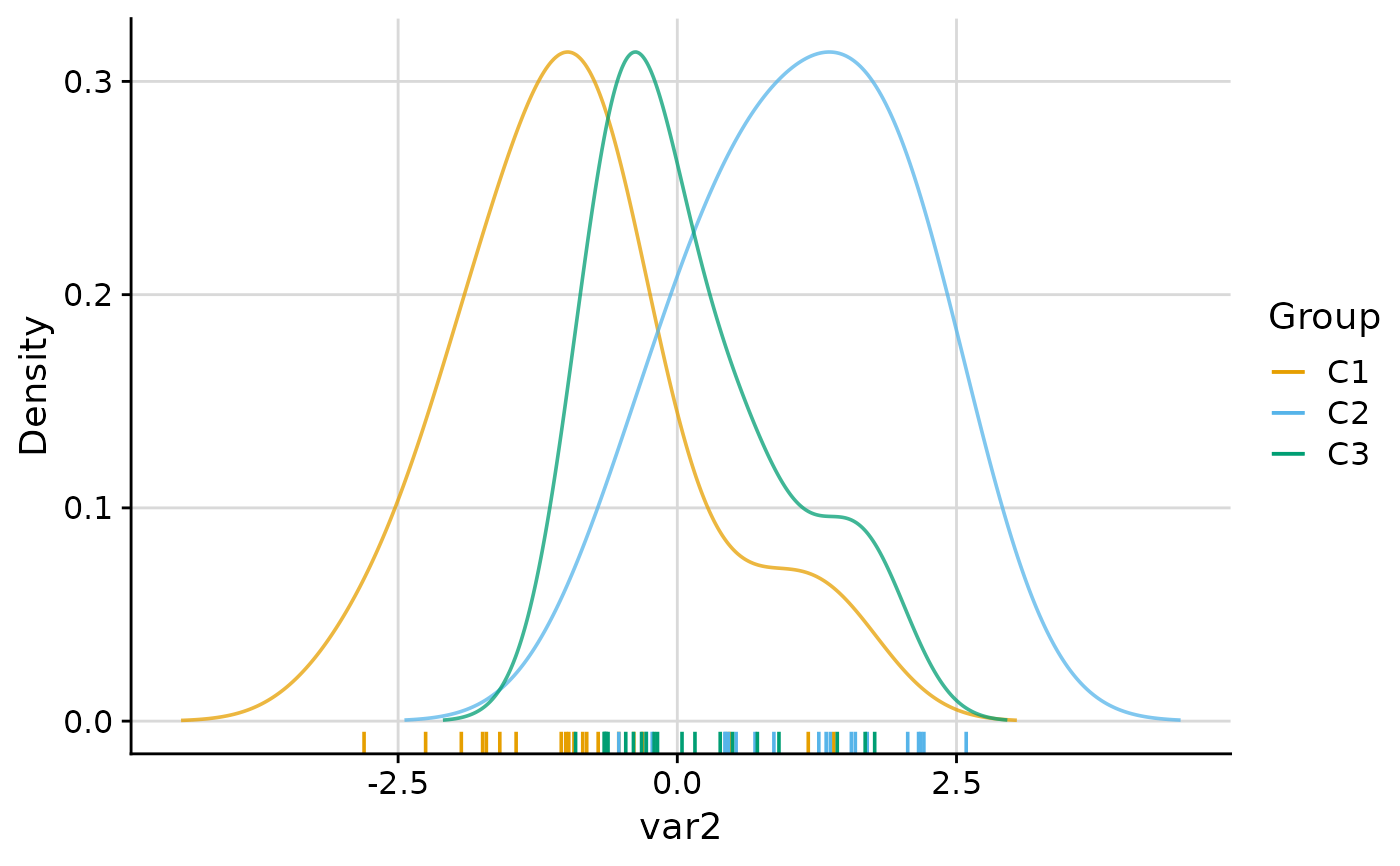
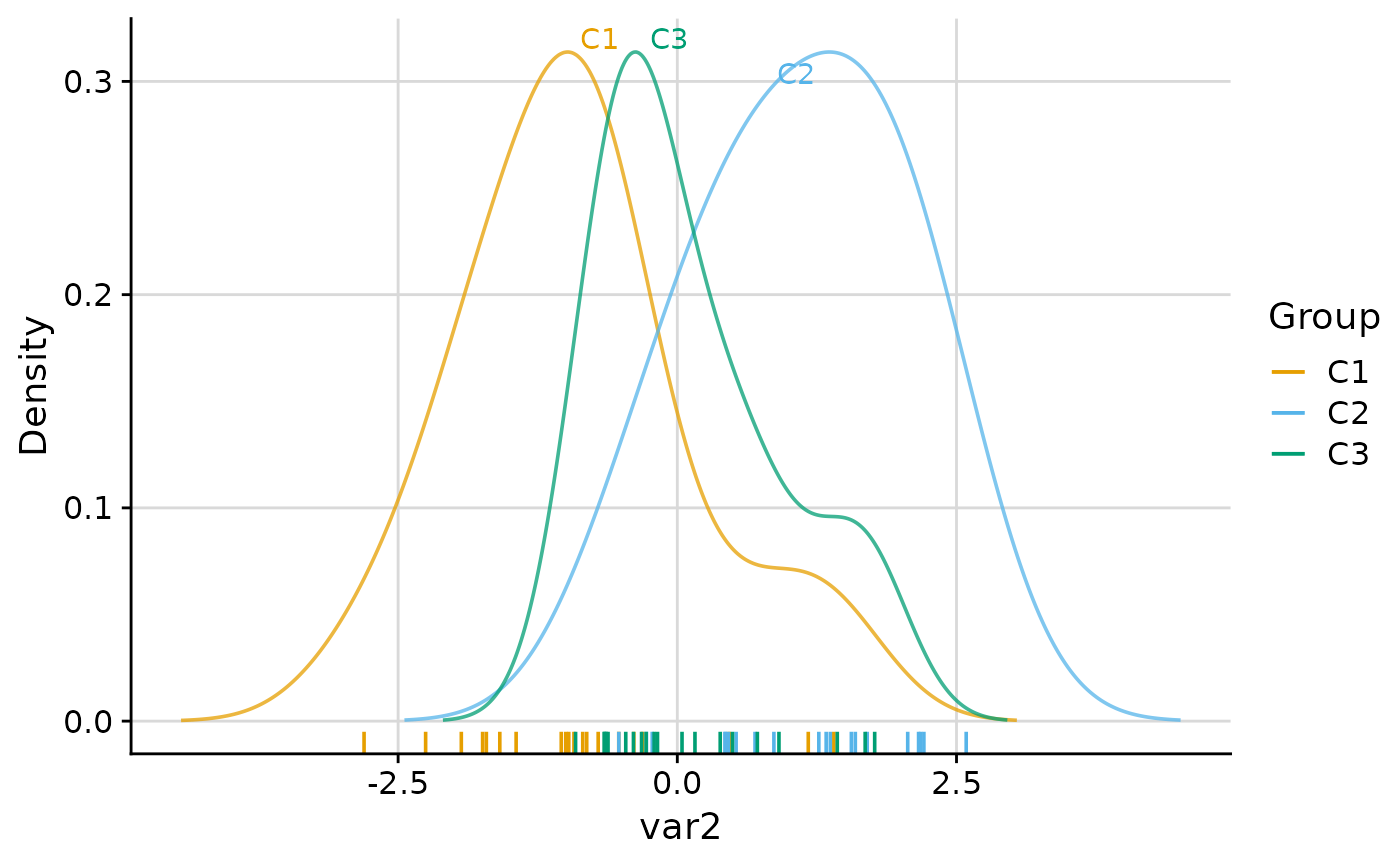
# Per-group density curves only
plot_group_density(.data, group = "group", density = "cluster")
#> $var1
#>
# Per-group density curves only
plot_group_density(.data, group = "group", density = "cluster")
#> $var1
 #>
#> $var2
#>
#> $var2
 #>
# Even-weighted overall density
plot_group_density(
.data, group = "group", density_overall_weight = "even"
)
#> $var1
#>
# Even-weighted overall density
plot_group_density(
.data, group = "group", density_overall_weight = "even"
)
#> $var1
 #>
#> $var2
#>
#> $var2
 #>
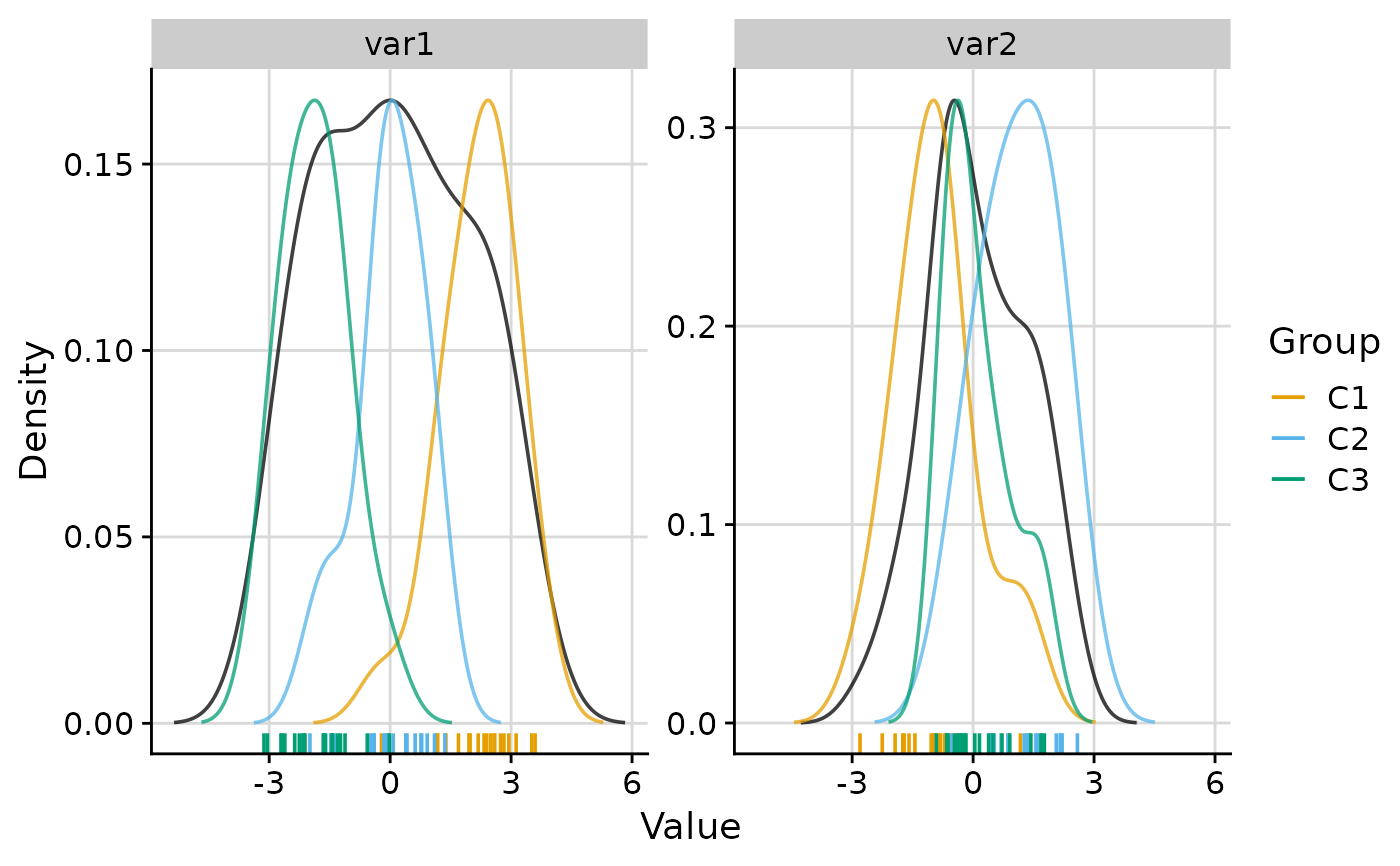
# Faceted plot with 2 columns
plot_group_density(.data, group = "group", n_col = 2)
#>
# Faceted plot with 2 columns
plot_group_density(.data, group = "group", n_col = 2)
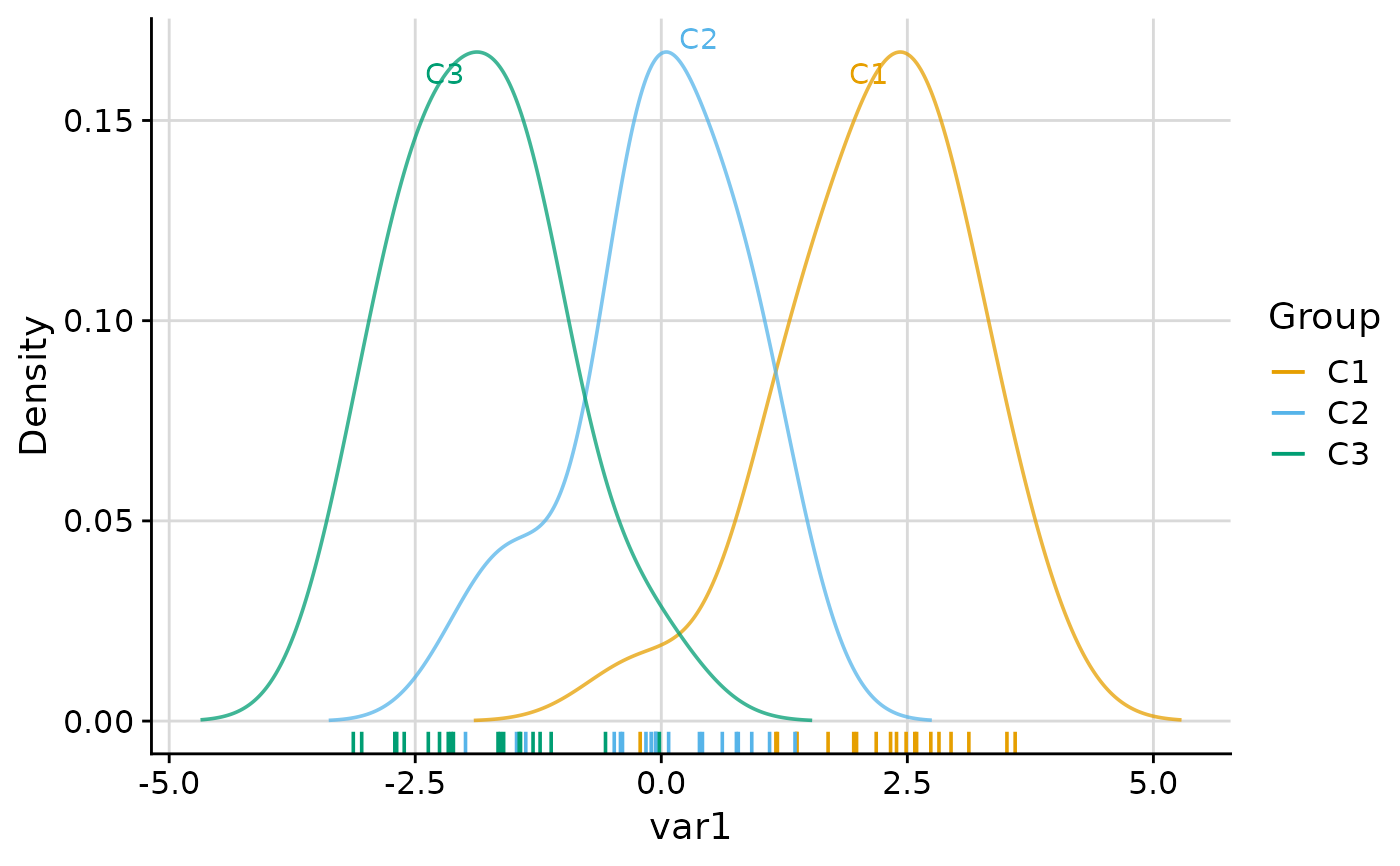
 # On-plot labels at density peaks
plot_group_density(.data, group = "group", density = "cluster", label = TRUE)
#> $var1
# On-plot labels at density peaks
plot_group_density(.data, group = "group", density = "cluster", label = TRUE)
#> $var1
 #>
#> $var2
#>
#> $var2
 #>
# Always show the legend regardless of group count
plot_group_density(.data, group = "group", legend = TRUE)
#> $var1
#>
# Always show the legend regardless of group count
plot_group_density(.data, group = "group", legend = TRUE)
#> $var1
 #>
#> $var2
#>
#> $var2
 #>
#>