Plot heat map of scaled variable values per group
Source:R/plot_cluster_heatmap.R
plot_group_heatmap.RdCreates a heat map where each tile shows a scaled summary of a variable for
a group. The scaling method is controlled by the scale_method parameter.
By default (scale_method = "ecdf"), each tile shows the percentile of the
group's median value compared against the empirical cumulative distribution
function (ECDF) of that variable across all observations not belonging to the
group. Groups and variables are ordered along the axes via hierarchical
clustering.
Usage
plot_group_heatmap(
  .data,
  group,
  vars = NULL,
  scale_method = "ecdf",
  palette = "bipolar",
  col = c("#2166AC", "#F7F7F7", "#B2182B"),
  col_positions = "auto",
  white_range = c(0.4, 0.6),
  na_rm = TRUE,
  font_size = 14,
  thm = cowplot::theme_cowplot(font_size = font_size) + ggplot2::theme(plot.background =
    ggplot2::element_rect(fill = "white", colour = NA), panel.background =
    ggplot2::element_rect(fill = "white", colour = NA)),
  grid = cowplot::background_grid(major = "xy"),
  show_values = FALSE,
  values_format = NULL,
  values_col = "black",
  values_size = 3
)

plot_cluster_heatmap(.data, cluster, ...)
Arguments
- .data
data.frame. Rows are observations. Must contain a column identifying group membership and columns for variable values.
- group
character. Name of the column in
.datathat identifies group membership.- vars
character vector or
NULL. Names of columns in.datato use as variables. IfNULL, all columns exceptgroupare used. Default isNULL.- scale_method
character. Method used to scale variable values for colouring cells. One of
"ecdf"(default),"zscore","raw","minmax", or"minmax_var"."ecdf": Each cell shows the percentile of the cluster's median value compared to all observations outside the cluster (empirical CDF). Fill values are in [0, 1] and the legend uses percent labels."zscore": Each cell shows the z-score of the cluster's median relative to all observations of that variable ((median - mean) / sd). Fill values are unbounded."raw": Each cell shows the raw median value. Fill values are unbounded."minmax": Each cell shows the cluster median scaled to [0, 1] using the global minimum and maximum across all observations of all variables. Fill values are in [0, 1] and the legend uses percent labels."minmax_var": Each cell shows the cluster median scaled to [0, 1] using the minimum and maximum of all observations within each variable separately. Fill values are in [0, 1] and the legend uses percent labels.
- palette
character or
NULL. Named colour palette for the continuous fill scale. When notNULL, overridescolandcol_positions. Available palettes:"bipolar"(default, blue-white-red),"alarm"(green-white-red, good-to-bad),"accessible"(blue-white-orange, colour-blind-safe diverging),"heat"(light-yellow to dark-red, sequential),"sky"(white to navy, sequential). Set toNULLto usecolandcol_positionsdirectly.- col
character vector. Colours used to fill tiles, ordered from low to high values. Default is
c("#2166AC", "#F7F7F7", "#B2182B")(blue, white, red). Any number of colours (>= 2) is accepted. Ignored whenpaletteis notNULL.- col_positions
numeric vector or
"auto". Positions (in [0, 1]) at which each colour incolis placed on the fill scale. Must be the same length ascol, sorted in ascending order, with the first value0and the last value1. When"auto"(default) andcolhas exactly three colours andscale_method = "ecdf", the middle colour is stretched overwhite_range(the current default behaviour). In all other"auto"cases the colours are evenly spaced from 0 to 1. Ignored whenpaletteis notNULL.- white_range
numeric vector of length 2. The range of positions (on a 0-1 scale) over which the middle colour is stretched. Only used when
colhas exactly three colours,scale_method = "ecdf", andcol_positions = "auto". Also applied to divergingpalettepresets (those withcol_positions = "auto"). Default isc(0.4, 0.6).- na_rm
logical. Whether to remove
NAvalues before computing per-cluster statistics. WhenTRUE(default),NAvalues are removed and a message is issued showing how many were removed per variable. WhenFALSE,NAvalues are passed through: tile fill values will beNA(rendered as grey by default) where a variable has no non-missing observations in a cluster.- font_size
numeric. Font size passed to
cowplot::theme_cowplot. Default is14.- thm
ggplot2 theme object or
NULL. Default iscowplot::theme_cowplot(font_size = font_size)with a white plot background. Set toNULLto apply no theme adjustment.- grid
ggplot2 panel grid or
NULL. Default iscowplot::background_grid(major = "xy"). Set toNULLfor no grid.- show_values
logical. Whether to overlay the median value for each cluster-variable combination as a text label on each tile. Default is
FALSE.- values_format
function or
NULL. A function that takes a numeric vector and returns a character vector of formatted labels. Applied to the per-cluster median values whenshow_values = TRUE. WhenNULL, values are formatted to three significant figures usingformatC(x, digits = 3, format = "g"). Default isNULL.- values_col
character. Colour for the overlaid text labels. Default is
"black".- values_size
numeric. Font size (in
ggplot2units) for the overlaid text labels. Default is3.- cluster
character. Name of the column in
.datathat identifies group membership. Alias for thegroupparameter.- ...
Additional arguments passed to
plot_group_heatmap().
Examples
set.seed(1)
.data <- data.frame(
group = rep(paste0("C", 1:3), each = 20),
var1 = c(rnorm(20, 2), rnorm(20, 0), rnorm(20, -2)),
var2 = c(rnorm(20, -1), rnorm(20, 1), rnorm(20, 0))
)
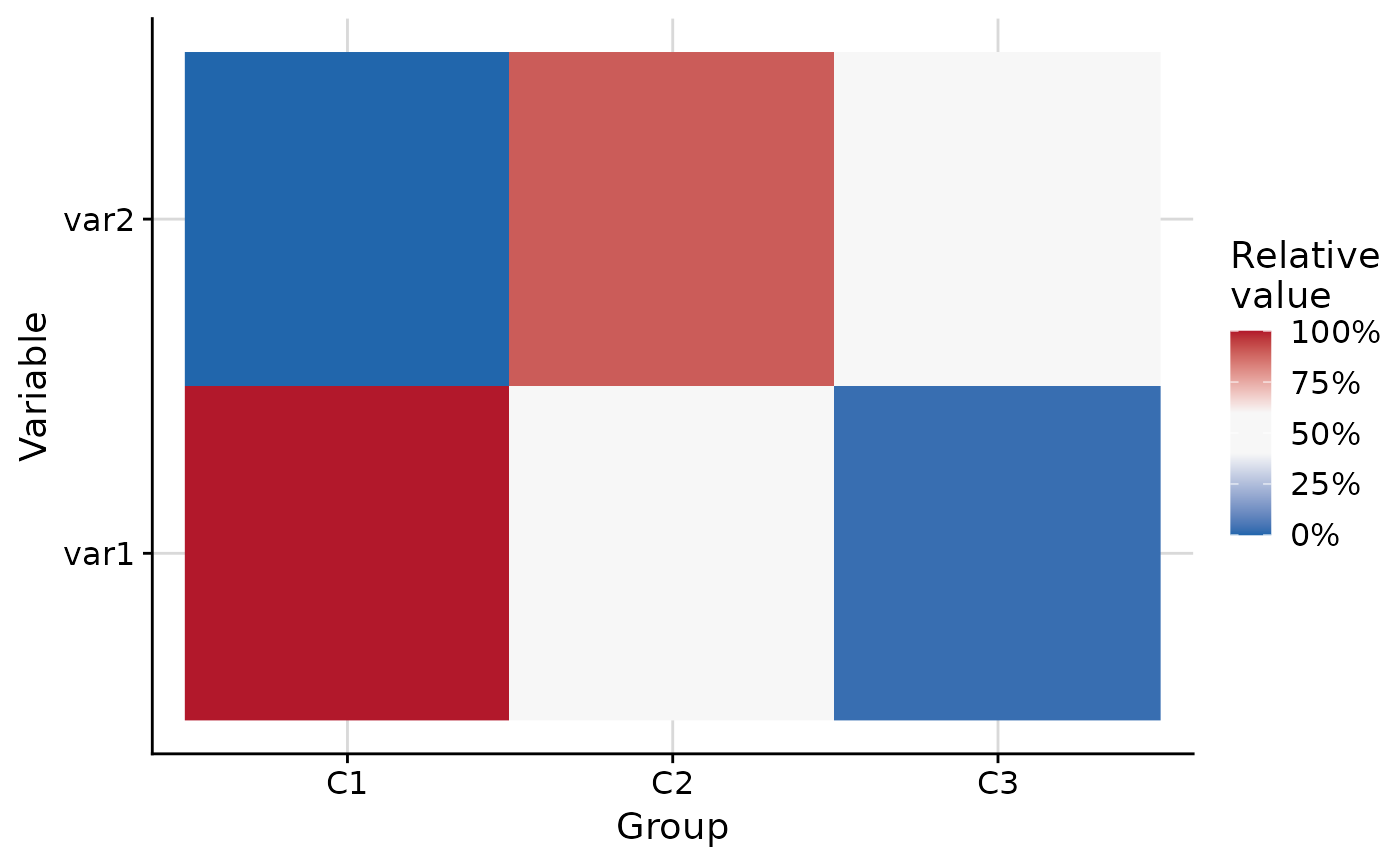
plot_group_heatmap(.data, group = "group")
 plot_group_heatmap(.data, group = "group", show_values = TRUE)
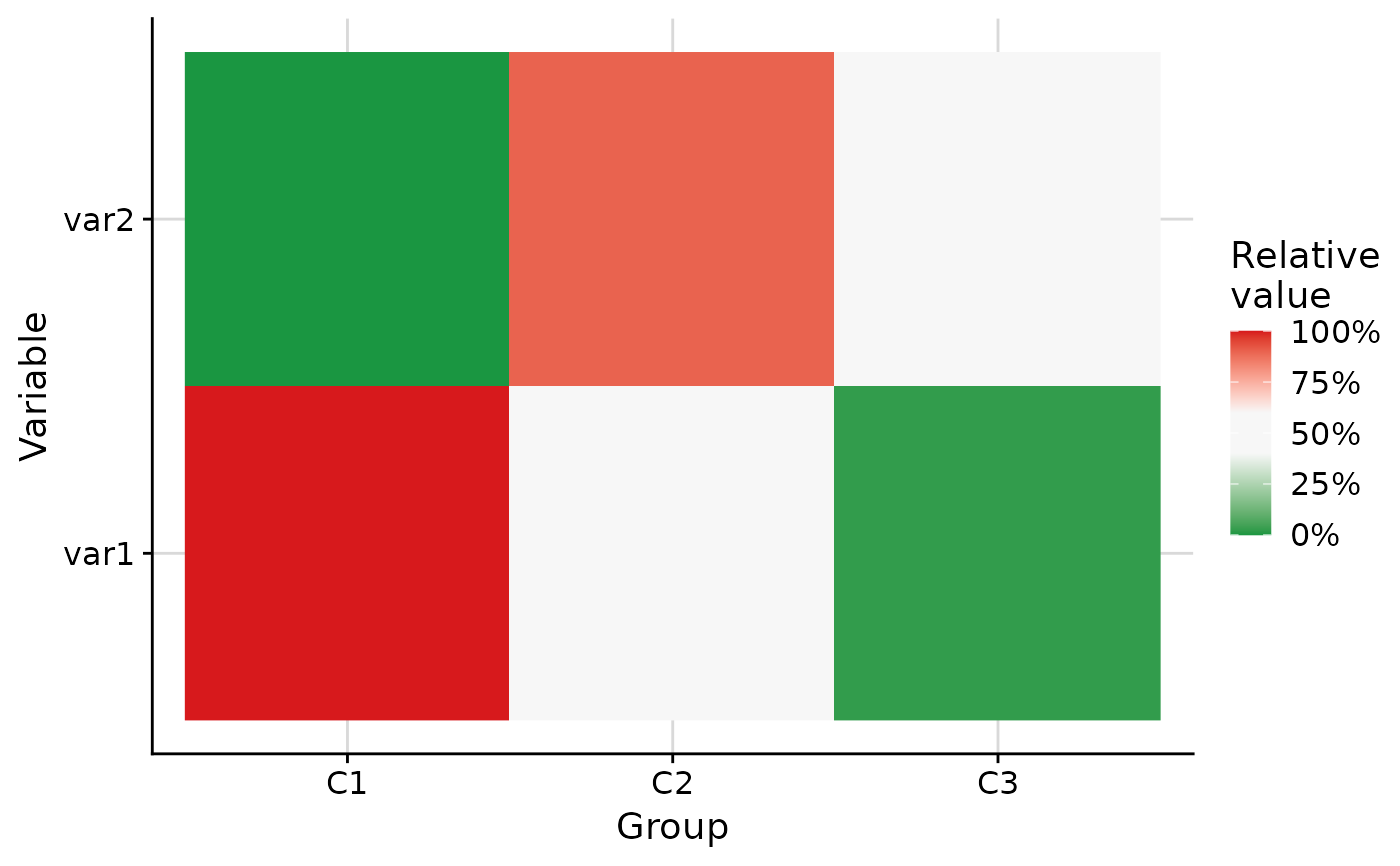
 plot_group_heatmap(.data, group = "group", palette = "alarm")